


[Bitcoin Daily] The 'Golden Cross' signal has failed! Bitcoin collapses below the 90,000 mark, Trump hints Greenland plan will be known 'very soon'.
FX168 Financial News Agency (Asia-Pacific) reported that the cryptocurrency market is experiencing further declines as global financial markets undergo significant sell-offs and investors continue to reduce their risk exposure amid ongoing geopolitical tensions. On Wednesday (January 21), Bitcoin fell below $90,000, reaching its lowest level in over a week.
The total market capitalization of the cryptocurrency market currently stands at $3.01 trillion, with a 4.27% decline over the past 24 hours. Both Bitcoin and Solana have broken below key support levels, forming candlestick patterns characterized by substantial bodies and clear directional movement – leaving little room for ambiguous interpretation. #BitcoinDaily#
According to data from the cryptocurrency trading platform CoinDesk, as of the time of writing, Bitcoin continued to weaken, trading at $89,450, marking a decline of more than 4% over the past 24 hours. Compared to a year ago, the drop is approximately 14%.
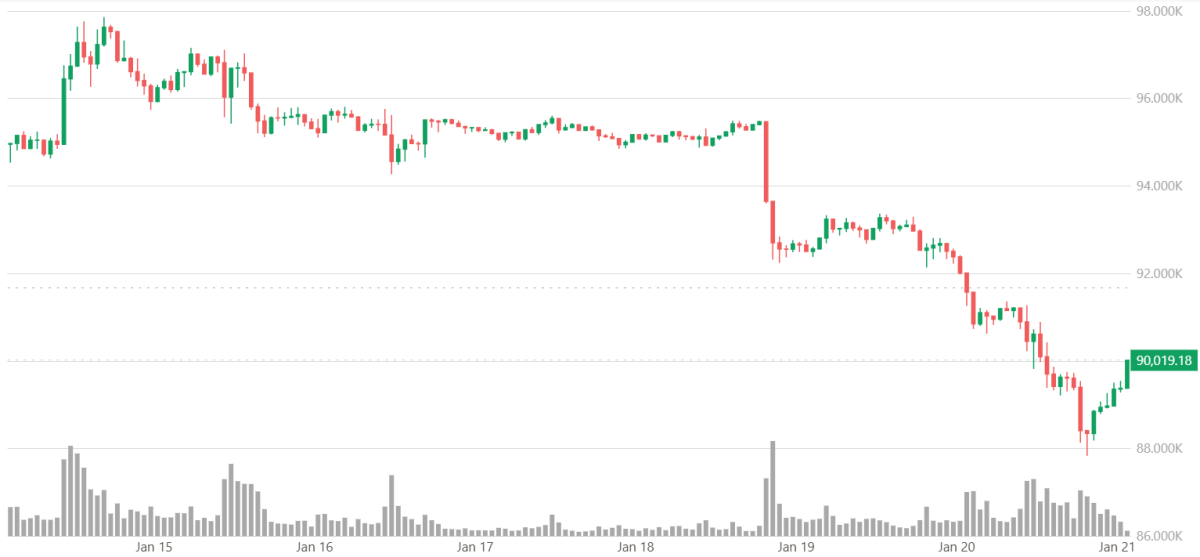
 (Source: CoinDesk)
Bitcoin has declined for six consecutive trading days, with short-term cumulative losses nearing 8%. Against this backdrop, selling pressure has started to exhibit characteristics of consolidation and continuation as market uncertainty rises and risk appetite declines. Since Bitcoin is still regarded as a risk asset, it has absorbed some of the impact from the overall weakening of risk assets; as long as demand continues to show signs of fragility, the current selling pressure may become more influential in the coming trading sessions.
Smaller-cap tokens with lower liquidity experienced even steeper declines: Ethereum fell more than 7%, breaking below the $3,000 mark. Solana dropped 5.3%. Stocks related to cryptocurrencies also weakened simultaneously. Coinbase Global's share price fell by 5.6%; Strategy Inc., formerly known as MicroStrategy and often referred to as a 'Bitcoin hoarder,' saw its shares plummet nearly 8%.
Massive purchases by Strategy
Meanwhile, Strategy, led by Michael Saylor, announced on Tuesday that it had purchased nearly $2.13 billion worth of Bitcoin over the previous eight days, marking its largest single purchase since July of last year.
Jake Ostrovskis, head of over-the-counter trading at Wintermute, stated: “Today’s news about MSTR’s largest purchase in the past seven months indicates that there remains significant demand, both among retail and institutional investors, to gain Bitcoin exposure through ‘equity vehicles’ such as stocks.” He added: “Driven by this news, we observed Bitcoin outperforming Ethereum during the day.”
So far this year, cryptocurrency investors have net-invested approximately $1.2 billion into roughly a dozen Bitcoin ETFs listed in the United States. Previously, these inflows had helped push up Bitcoin prices following a market pullback last year.
Despite the announcement of a large Bitcoin purchase by MicroStrategy, one of the most significant Bitcoin holders, the cryptocurrency has plummeted sharply amid heightened market volatility. Although MicroStrategy recently acquired approximately $2.13 billion worth of Bitcoin over eight days, it recorded unrealized losses of about $17.4 billion on digital assets in the fourth quarter of last year. This has been viewed as a key factor dampening investor sentiment.
Bloomberg News analysis stated: 'The overall volatility in the cryptocurrency market, along with corporate disclosures of unrealized losses, has negatively impacted investor sentiment, and market optimism towards cryptocurrencies is cooling.' Reuters also noted: 'The synchronized decline in MicroStrategy's stock price and Bitcoin suggests that the market may interpret this large-scale purchase as a signal of a 'temporary peak.'
Trump Sparks Risk Aversion
Moreover, the geopolitical risks and trade conflicts triggered by President Trump’s recent proposal to 'purchase Greenland' have also influenced Bitcoin’s movements. According to CNBC, 'As controversies surrounding the Trump administration’s Greenland acquisition proposal escalate, alongside intensifying tariff conflicts with European countries, risk aversion towards risky assets in the market has significantly increased.'
European leaders have distanced themselves from U.S. President Trump over the Greenland issue and vowed to provide 'unwavering' support for Greenland and Denmark. When asked by White House reporters how much he would be willing to pay to acquire Greenland, Trump responded: 'You will know very soon.'
Driven by escalating diplomatic and trade tensions between the U.S. and Europe, market uncertainty continues to rise, creating an unfavorable environment for risk assets. This shift has weakened market appetite for high-risk investments and directly impacted the cryptocurrency market – Bitcoin is still widely regarded as a risk asset. As a result, some funds have shifted to more stable assets, suppressing short-term demand for BTC. Observing Bitcoin’s market capitalization, it has retreated from nearly $2 trillion on January 14 to approximately $1.78 trillion. This change reflects significant capital outflows, explaining the recent rapid decline in BTC prices and the erosion of tens of billions of dollars in cryptocurrency market value over the past few trading sessions.
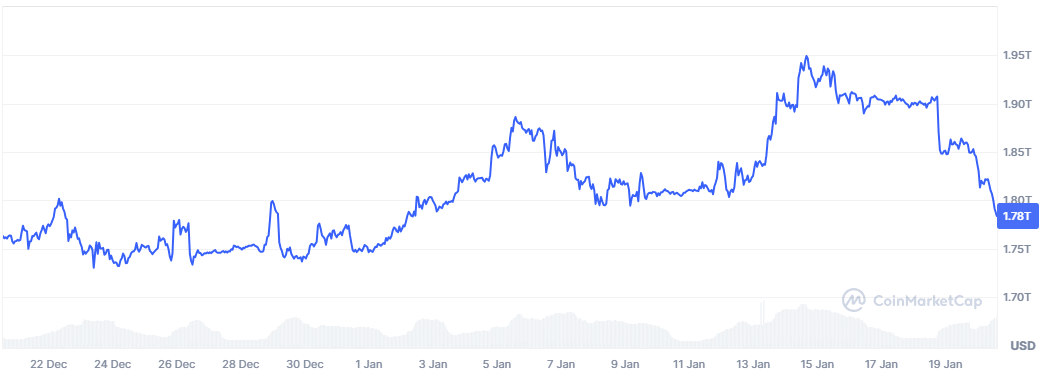
(Source: CoinMarketCap)
Meanwhile, the Open Interest metric has rebounded to around $29.8 billion, coinciding with Bitcoin’s recent drop below $90,000 per coin. It is important to note that Open Interest measures the total amount of open long and short positions in institutional markets. In this case, rising Open Interest alongside falling prices indicates a significant increase in short positions, signaling a decline in short-term confidence among institutional participants.
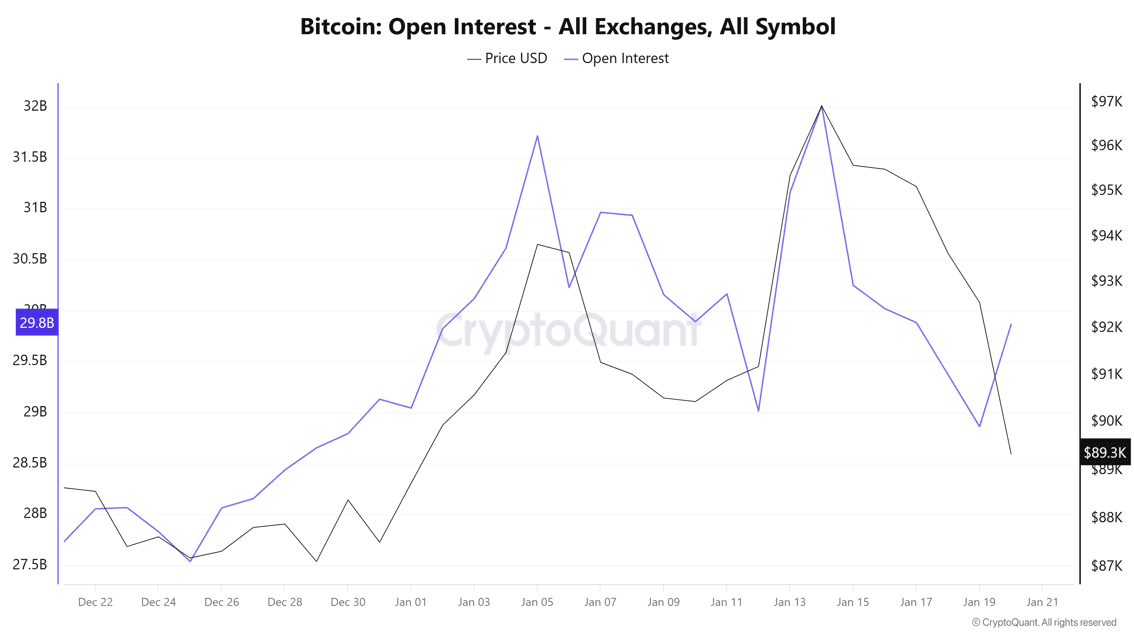
(Source: CryptoQuant)
Taken together, these changes indicate that the market is being dominated by a new wave of 'risk-off' sentiment, with a noticeable retreat in Bitcoin demand. As long as this risk-averse environment persists, selling pressure in the BTC market is expected to continue into subsequent trading sessions.
Shiliang Tang, Managing Partner at Monarq Asset Management, stated: 'Bitcoin’s sharp decline over the weekend reflects a broader withdrawal from risk assets in traditional macro markets. Reasons include threats from the White House to impose tariffs on European countries and geopolitical friction surrounding Greenland.' He added: 'The rise in gold and silver prices, along with the weakening of the U.S. dollar, confirms the narrative of capital flowing into safe-haven assets amid risk aversion triggered by America’s tough stance.'
Karim Dandashy, an over-the-counter trader at crypto trading firm Flowdesk, said: '$90,000 has proven to be a key level. Since the beginning of this year, we have repeatedly seen it act as effective support; in the short term, it is likely to be an important inflection point.'
Bitcoin Technical Analysis
On Myriad, the prediction market launched by Decrypt's parent company Dastan, traders are swiftly repricing: the probability of 'Bitcoin first surging to $100,000 and then dropping to $69,000' currently stands at 72.5%, significantly down from yesterday’s 85%. Meanwhile, 90% of bets on 'Solana hitting a new all-time high before July' have opted for 'no'.
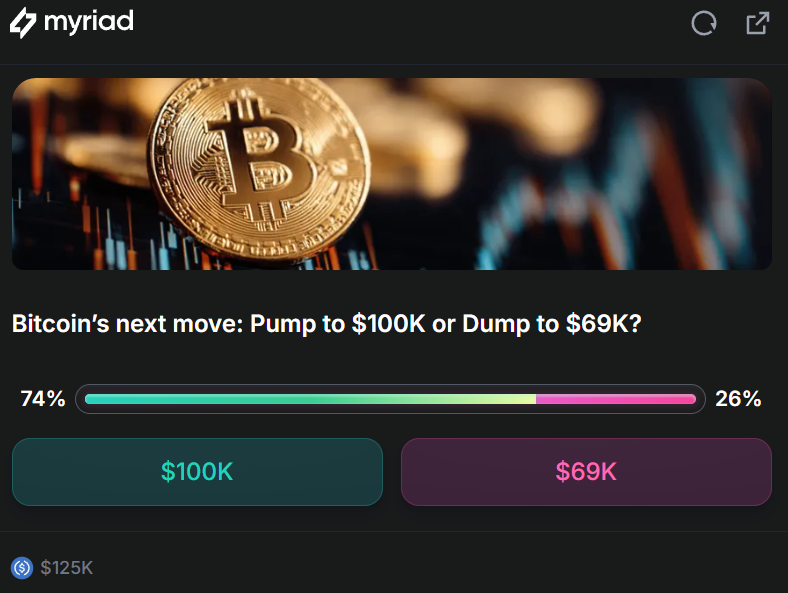
(Source: myriad)
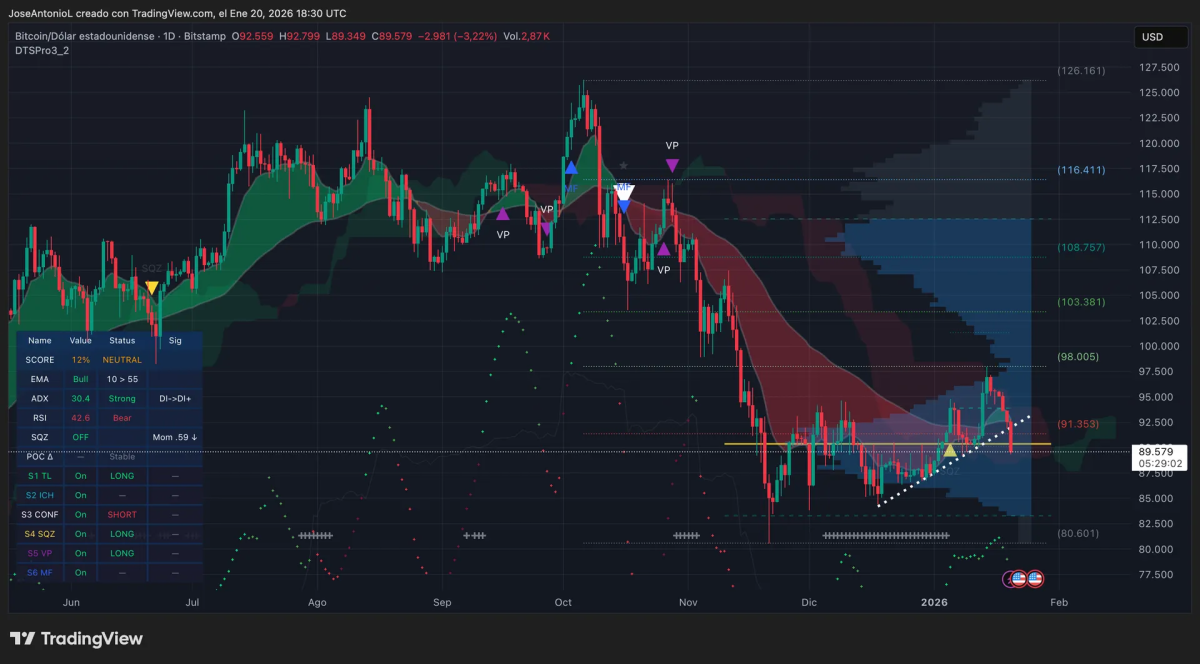
From the price chart perspective, bearish sentiment appears to be validated. Bitcoin fell below the psychological support level of $90,000 on Tuesday, meaning the 'golden cross' signal formed on the charts just days ago has now been invalidated. More importantly, the leading cryptocurrency has broken below the rising trendline that had provided support since December’s lows. The white dashed line in the chart, previously acting as a 'floor,' has now turned into 'overhead resistance.'
However, price support is not determined by short-term momentum but should reference medium- to long-term structures more heavily. A robust method involves using Fibonacci retracement/expansion levels between historical highs and late-November lows, which have been consistently 'respected' by the market.
(Chart: TradingView Bitcoin Price Data)
Regarding other technical indicators, Bitcoin’s Average Directional Index (ADX) is currently at 30.5, declining nearly 3 points from yesterday’s reading, indicating that bullish rebound momentum is rapidly diminishing. ADX measures trend strength (irrespective of direction) within a range of 0 to 100, with readings above 25 typically suggesting an established trend.
The Relative Strength Index (RSI), also measured within a 0 to 100 range, typically indicates overbought conditions above 70 and oversold conditions below 30. Currently, with ADX at 30.5 and RSI at 41.7, combined signals suggest Bitcoin remains in a slightly bearish zone but has not yet entered oversold territory. For traders, this structure often implies downward pressure may not fully dissipate before a meaningful rebound occurs.
The next major support area is roughly around the Fibonacci level of approximately $80,600 visible on the daily chart, about 10% lower than the current price.
Exponential Moving Averages (EMAs) are used to identify trends based on short-, medium-, and long-term average prices. Bitcoin’s 200-day EMA (average price over the past 200 days) is widely regarded as the 'watershed' for medium- to long-term bulls, and this level has already been breached. When Bitcoin breaks below this threshold with large-bodied candles and minimal wicks, it typically suggests further downside pressure before significant buying interest emerges.
Key Price Levels
Resistance Levels:
$91,500 (near-term)
$98,000 (strong resistance)
Support Levels:
$86,000 (near-term)
$80,500 (Fibonacci key level)
Content Original Link:
" target="_blank">


